
Aggregate statistics can tell you that 9% of EU households are energy poor. They cannot tell you how those households got there, how they interact with markets and policy, or what happens to them when energy prices spike by 40% in a single year. For questions like these — questions about dynamics, feedback loops, and heterogeneous behaviour — agent-based modelling (ABM) offers something no regression table can.
In an agent-based model, the system is not described top-down with aggregate equations. Instead, individual agents — in this case, households — are given attributes (income, dwelling type, household size, energy contract) and simple behavioural rules (adjust heating when bills exceed a threshold, apply for a subsidy when income falls below a level, renovate if savings accumulate). The researcher then runs the simulation and observes what macro-level patterns emerge from millions of individual micro-decisions. The model does not assume a representative household; it populates a heterogeneous population and lets poverty emerge from their interactions.
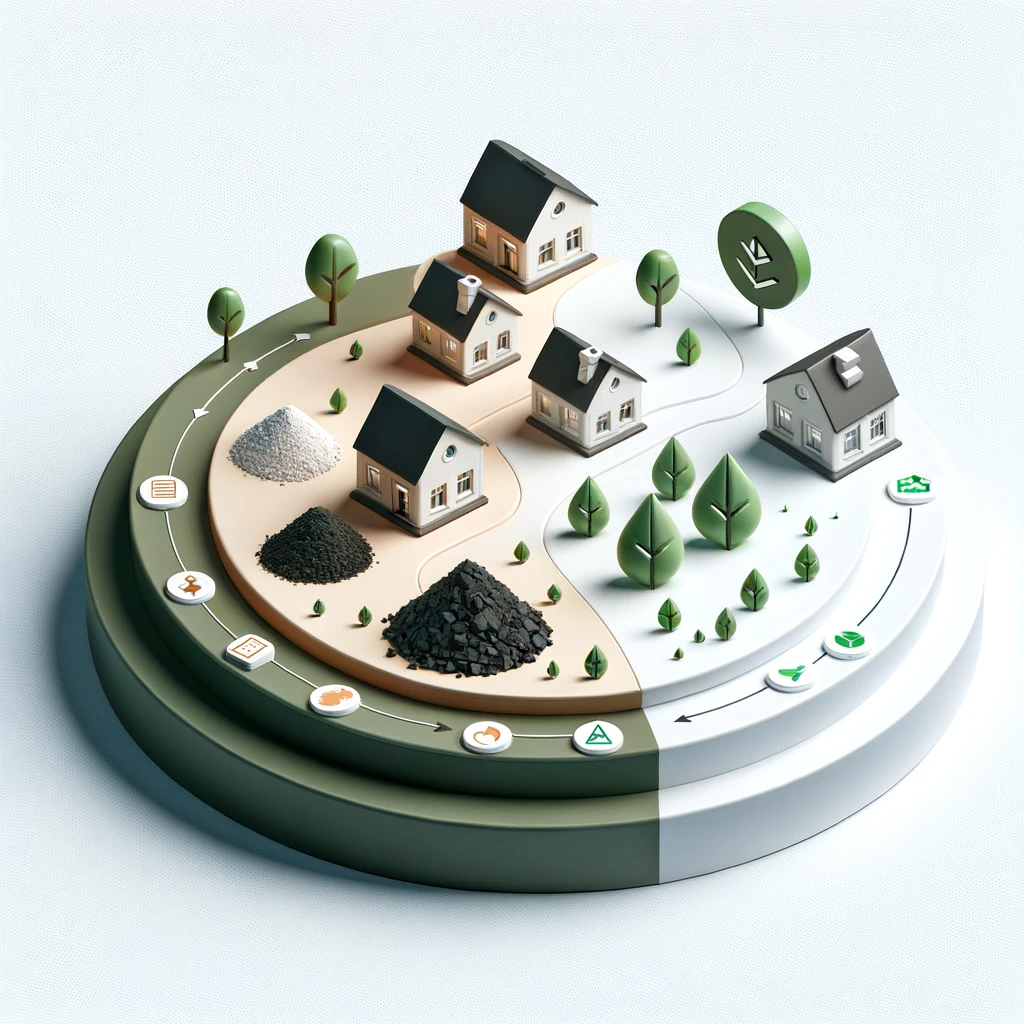
Visualisation of household states across a simulated neighbourhood. Colour indicates energy poverty status across a simulation timestep.
The model presented here is implemented in Python using the Mesa framework — an open-source, accessible alternative to NetLogo that integrates naturally with the broader scientific Python ecosystem (pandas, NumPy, matplotlib). Households are initialised from distributions calibrated to EU-SILC data, giving each agent a realistic income, dwelling efficiency class, and energy expenditure profile. At each timestep (representing one month), agents respond to energy price signals, apply behavioural heuristics around consumption, and may enter or exit energy poverty depending on their budget balance.
The key insight ABM adds over traditional econometric models is the ability to study path dependence. A household that falls into energy poverty one winter may deplete savings, fall behind on bills, and incur penalty charges that keep it poor the following winter — even after the original price shock recedes. This kind of hysteresis is structurally invisible in cross-sectional survey data, where the same household appears simply as "poor" in year one and "not poor" in year three without any trace of what happened in between.
One of the most valuable outputs of the ABM approach is counterfactual analysis. Rather than asking "how many households are poor now?", the model can ask "how many would have been poor if the 2022 price cap had not been introduced, and for how long?". This kind of policy simulation — run thousands of times with stochastic variation — provides richer guidance than a single regression coefficient, particularly when the policy being evaluated is novel and out-of-sample.
Current development focuses on incorporating spatial heterogeneity (urban/rural dwelling efficiency gaps), richer energy contract modelling (fixed vs variable tariffs, prepayment meters), and integration with real-price timeseries from Eurostat to allow historically calibrated scenario runs.